
Google Analytics 4 Agency
GA4 Migration & Consulting Services
Configuring Google Analytics 4 unlocks your business potential. Website Pandas will help you get started with GA4, improve your data collection, and perform audits that yield the best results.
5/5
0
/ 5.0

0
K
Happy customers
Please fill in your details below
to get free quote
We Work With


About Us
Power your business with data-driven insights
Website Pandas provides the most extensive range of Google Analytics 4 services to businesses of all sizes. Our experts help you leverage the platform fully by setting up custom tracking, training your teams, and integrating the platform into your data pipeline. Our GA4-trained teams and marketers create custom migration plans based on your needs so you can utilize advanced analytics to boost your business growth.
Our Google Analytics 4 Services
Our comprehensive services ensure you get the most from the advanced GA4 platform.
1/ GA4 Setup
We help you set up and install Google Analytics 4 quickly and easily. We manage your GA4 setup with Google Tag Manager so you can benefit from a strong analytics infrastructure. In addition, our experts create a plan to keep your accounts updated with Google Analytics.
2/ GA4 Audit
Our specialists conduct a thorough audit to ensure that your GA4 is optimized for your needs. Our audit analyzes data discrepancies with Universal Analytics, custom tracking events, eCommerce event configuration, Google Ads integration, report configurations, and more. We provide a detailed report of our insights and recommend fixing issues.
3/ GA4 Migration Services
Website Pandas comprehensively plans your move from Universal Analytics to Google Analytics 4. Our experts ensure all major elements are set up correctly so your data recording can occur accurately within GA4. Our migration approach is based on a study of your goals, the level of developer support you seek, and your need for GA enhancements.
4/ GA4 Training & Consulting Services
Our teams of Google Analytics specialists offer personalized training for GA4. The training modules we deliver are built to answer your specific questions and challenges regarding GA4. Our experts roll out training sessions in-person or remotely so your stakeholders understand the intricacies of the new platform and your team members can upskill themselves.
5/ Big Query & Data Integrations
We integrate Big Query, Google’s AI-ready data analytics platform, with your Google Analytics 4 to enable advanced data segmentation and analysis. After Big Query integration, we can also merge different databases to consolidate your data from disparate sources for in-depth analysis.
6/ Custom Tracking Setup
Our professionals configure custom event tracking in Google Analytics 4 to make the platform produce meaningful reports. We can customize custom tracking by specifying custom dimensions or using Google Tag Manager. We then test the custom events to ensure that information is tracked accurately.
7/ Custom Reporting
Our experts configure custom reports in GA4 using the Explore tab. We can also create GA4 Funnel Exploration reports and GA4 Behavior Exploration Reports according to your specific needs. Our GA4 specialties focus on the significant metrics you need when setting up custom reports.
8/ Google Analytics 4 Support
Website Pandas delivers ongoing support after you transition to GA4. We supply key insights to your company based on the data being collected by the platform. This includes consumer data, cross-channel insights, your content that is doing well, and a deep analysis of your key performance indicators.
Best GA4 Features
GA4 is packed with a number of features to help you bring revolutionizing changes.
Predictive Analytics
GA4 is equipped with predictive analytics. It creates predictive audiences for churners and purchasers on your website. Predictive metrics in GA4 detect and present customer trends and user behaviors. They accurately forecast whether users will buy or stop making purchases.
Better Google Ads Integration
GA4 lets you import your audience on the platform to Google Ads and then target them through retargeting campaigns. By linking a Google Ads account with GA4, you can explore the entire customer cycle and how people interact with your marketing efforts.
Customer-Centric Measurements
The customer-centric measurement feature lets you map, consolidate, and de-duplicate your visitors' interactions across their devices on your website and app. It provides cross-channel visibility of their journey and behavior on your website.
Machine Learning and Smarter Insights
Integration of AI and machine learning in GA4 leads to the effective detection of unusual patterns in data. Detecting deviations allows you to assess whether the unusual patterns are only outliers or an underlying issue that you should immediately address. AI also produces custom insights according to your business needs.
Improved Data Controls for Privacy Compliance
The new GA4 platform fully complies with data privacy regulations like CCPA and GDPR. It has a consent mode to implement a user consent mechanism, data deletion, and data retention controls. These hands-on privacy controls were not a part of the earlier version.
Google BigQuery Integration
Google Analytics 4 connects with BigQuery for free. BigQuery is a data warehouse that processes huge sets of data. Through the connection between GA4 and BigQuery, you can analyze the data of thousands of users on your online store.
DebugView
Through DebugView, you can view the events and user activities from the analytics interface. It thus becomes easy to fix issues because you are aware of the user's live activity.
Improved Reports
GA4 offers better reporting as you can create detailed custom reports. The reports are versatile and easy to use. You can customize them, add a filter, edit charts, and tailore specific overview reports.
Our GA4 Migration Process
We follow a careful migration process from start till end.
1/ Initial Planning / Discovery
Our migration begins by discovering the scope of the process. We then perform an audit and assess your existing data collection methods, aiming to identify elements that can affect your migration to GA4.
2/ Architecture & Implementation
After initial planning, Website Pandas will implement Google Analytics 4 on your website or mobile application. We will configure the new properties, views, and goals. We will also set up custom events and tracking as well as cross-domain tracking.
3/ Quality Assurance
Our experts check whether all the things that have been configured are according to your needs and goals. We perform a thorough quality assurance check to make sure that the platform serves you well.
4/ Deployment
Finally, we deploy the accurately configured Google Analytics 4 on your website or app. We offer continuous support after the deployment to ensure that you are able to meet your business goals through its insights.
Why Choose Us?
Top Ranked GA4 Migration & Consulting Agency
Your success through GA4 is our top priority. Here’s why you should partner with us.

0
+
Years of experience
0
+
Expert team
0
K+
Leads generated
1/ Data-Driven Strategies
Our experts follow data-driven strategies to help you get the most from data and reporting in GA4. Our strategies are based on the insights from our audit. We create robust measurement plans so you can leverage the most accurate data.
2/ Streamlined Process
We follow a streamlined process to set up Google Analytics 4. From audit to strategy, implementation, and monitoring, our process goes smoothly without any issues.
3/ Integration Experience
We are a Google Analytics 4 agency with seasoned marketing professionals who are certified in Google Analytics. Our teams have wide experience integrating GA into business websites and apps, so you can be assured of being in good hands.
4/ Dedicated Assistance
Our customer support team will help you whenever you need it. We provide responsive customer service, so you don’t need to wait and try to tackle issues on your own.
What Our Clients Say?
Your Partner With 15+ Years Of Expertise
“Partnering with Website Pandas for PPC has been the best decision for us. The team helped us save money on AdWords advertising while boosting the lead count. We could not even imagine creating and managing AdWords the way Website Pandas did. Now we know that we can successfully compete with our competitors.”

Mike Johnson
“The PPC team at Website Pandas should be the go-to choice for search engine marketing. They are responsive, accountable, and extremely knowledgeable. I loved how the experts here solely focus on client results and ROI. Their resources and PPC strategies have helped me drive maximum awareness and conversion.”

Shane Smith
“Working with Website Pandas has been an absolutely amazing experience. They’ve been our partners for over six years now, and there is nothing I would complain about. The team does everything to make your business unique and at the top of web searches. I would highly recommend the agency to anyone looking to improve their online presence.”

Matt McVicker
“Website Pandas seamlessly executed our digital marketing strategy with impressive skill. The team showed us how Google can be used in innovative ways. Our company has experienced consistent and exponential growth on channels that didn’t work for us before. Now, we consider Website Pandas more of an extension of our company than a partner.”

Sarah Walker
Case Studies
Be Part Of Our Success Stories

Beach Business Boom: SEO & Ads Campaign that Quintupled Revenue
Ankur Goyal
April 12, 2023

From Stagnant to Soaring: A B2B’s Explosive Growth with Google Ads!
Ankur Goyal
April 10, 2023
FAQs
Find Answers To Commonly Asked Questions
What is Google Analytics 4 (GA4)?
Google Analytics 4 is an event and session based analytics platform to help you measure traffic and user engagement across your websites and apps. GA4 replaced Universal Analytics on July 1, 2023.
Why Do You Need to Migrate to GA4?
GA4 provides you with highly actionable and privacy-safe insights about your customers. It can accurately tell the likelihood of conversions and churn and provide valuable data on metrics like clicks or file downloads.
Can I Use GA4 Alongside My Existing Google Analytics Properties?
Yes. Technically, it is possible to use GA4 with GA properties. The GA4 Property Setup Assistant tool creates a fresh GA4 property that collects data alongside your UA/GA property.
Does Installing Google Analytics 4 (GA4) Require Migration from Universal Analytics (UA)?
After installing GA4, migration from Universal Analytics to GA4 is crucial because Universal Analytics has stopped processing data. If you don’t want any mistakes in your tracking or measurements, it is best to migrate to GA4.
Why do I Need Professional Google Analytics 4 Agency?
Professional Google Analytics 4 agency helps you properly leverage Google’s latest analytics platform. Experts set up and configured the platform according to your specific goals to ensure that you get the most accurate data, which facilitates informed decisions.
Will All of My Website Data Transfer to GA4?
No. The historic website analytics data cannot transition into the new GA4 platform at present. GA4 can access only the event-based data it gathers itself. Historical data tracked with the UA property will be there for only six months after July 1, 2023.
How Much Do GA4 Migration Services Cost?
GA4 migration services can cost between $750 and over $10,000, depending on the complexity of your migration process. Some factors that impact the cost include your website’s size, data points to be tracked, and customizations needed.
Should I Migrate to Google Analytics 4?
Yes. You should migrate to GA4 because of two major reasons. Firstly, GA4 is a highly advanced analytics platform than Universal Analytics. If you don’t transition to it, you won’t be able to leverage its advanced analytics features. Secondly, Universal Analytics will cease to process your data by July 2024.
What’s the Difference Between Universal Analytics & Google Analytics 4?
Universal Analytics has only two user metrics: Total Users and New Users. In contrast, GA4 has three metrics: Total Users, Active Users, and New Users. Also, GA4 is more privacy-focused than UA.
Will Year-Over-Year Reporting still Work with GA4 Data Retention Limits?
GA4 data retention settings impact the availability of user and event-level data in explorations and funnel reports. The default retention time is either 2 months or 14 months, depending on the setting. If your year-over-year reporting needs data beyond this default period, you should change the retention setting to 14 months to enable comparisons.
Can You Import Data into Google Analytics 4?
Yes. You can import different types of data to GA4. It includes product data, user data by their IDs, and user data by client ID. The total storage limit for data in GA4 is 10 GB.
How Long Does GA4 Migration Take?
The migration to GA4 takes up to five days or a week to complete. The part of the process that takes the most time is checking that your objectives have been accurately migrated to conversions and adjusting the dashboard to your preferences.
Latest Posts
Stay Informed And Inspired

Google Ads Location Targeting: Top 10 Tips to Maximize Your ROI
Ankur Goyal
July 24, 2024
How to Exclude Mobile Apps in Google Ads? – EXPLAINED
Ankur Goyal
July 23, 2024
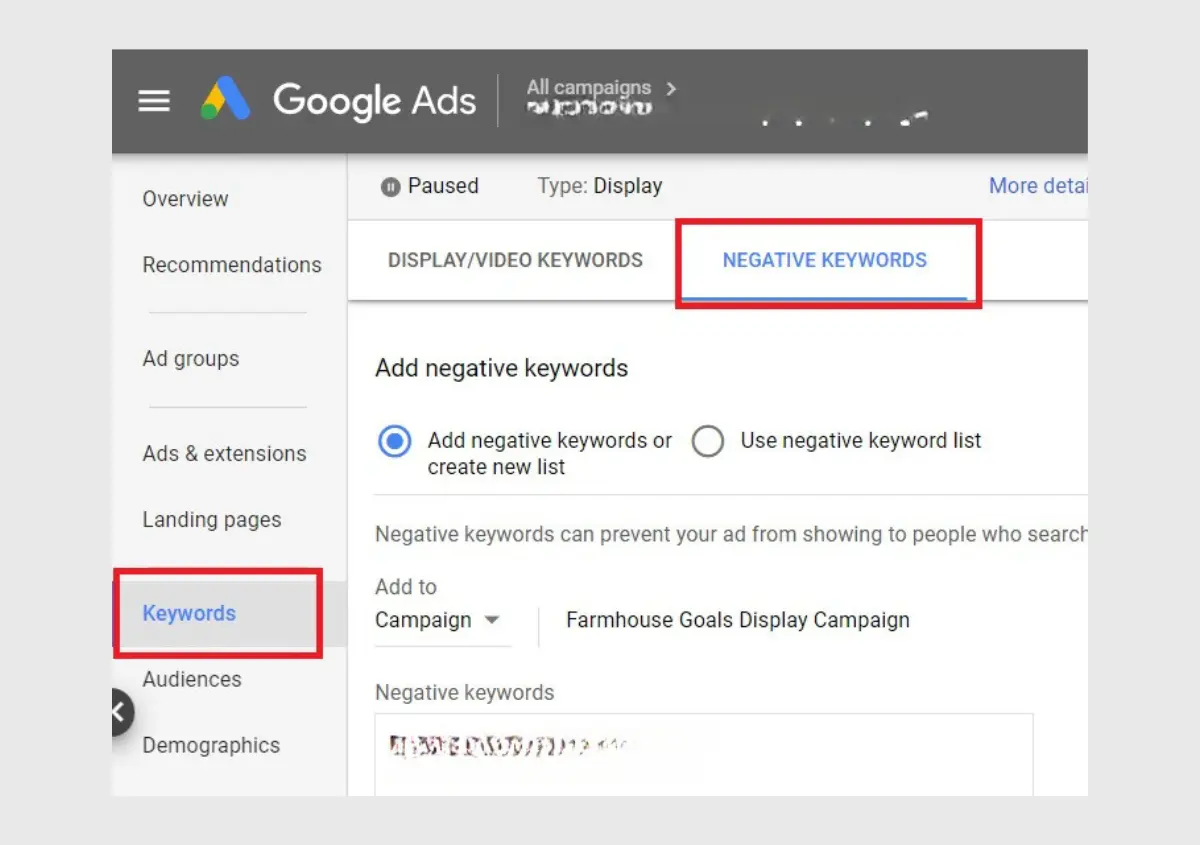
How to Add Negative Keywords in Google Ads – ANSWERED!
Ankur Goyal
July 19, 2024
Newsletter
Subscribe For Updates And Insights
Lorem ipsum dolor sit amet, consectetur adipiscing elit. Ut elit tellus, luctus nec ullamcorper mattis, pulvinar dapibus leo.